Week 19: Website Performance
ARC Digital Scorecard
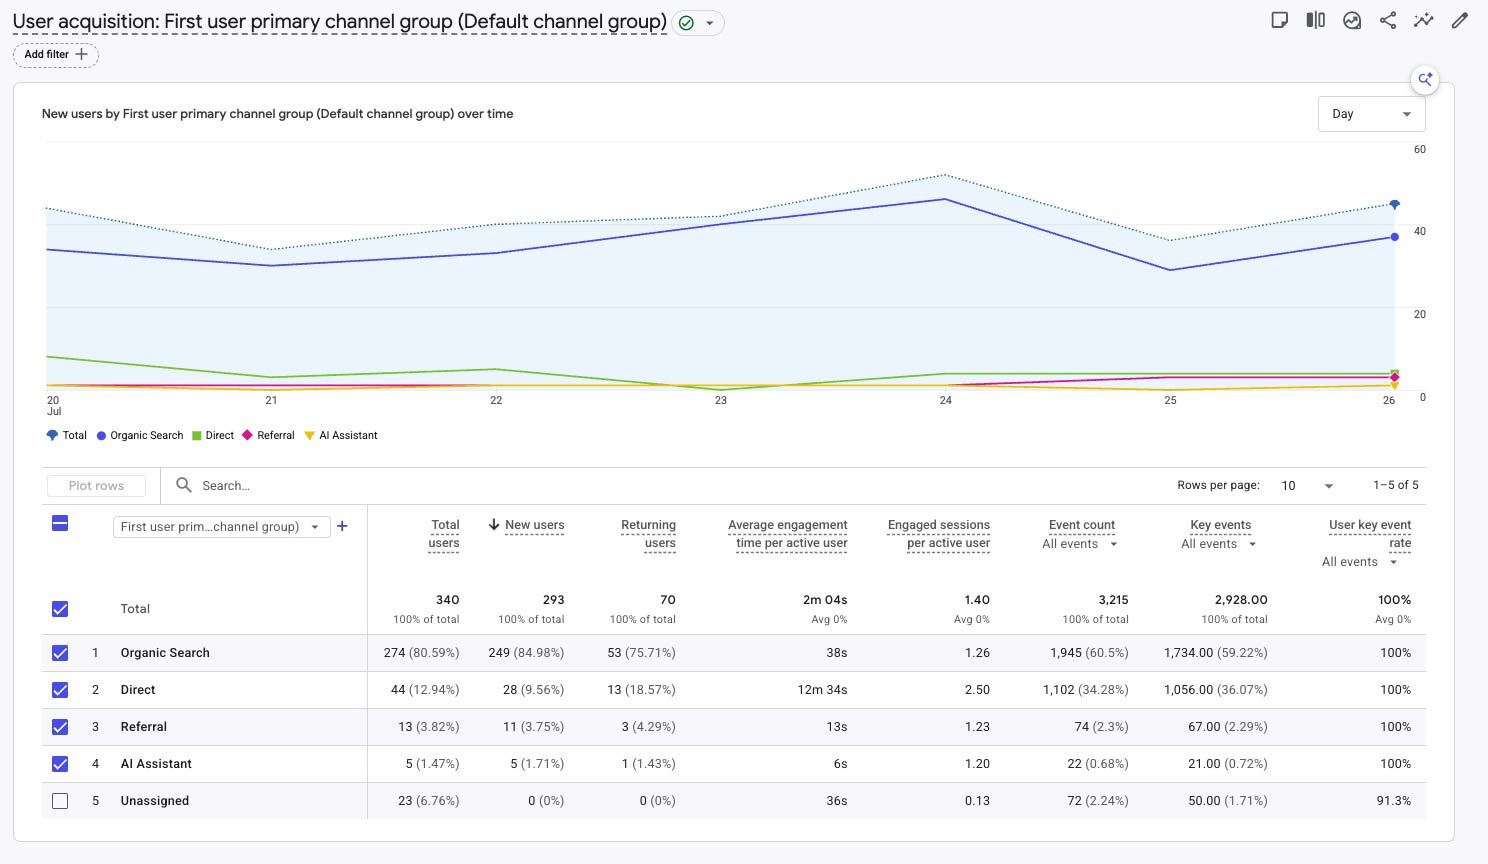
Overall website health remains positive. This is an analytical summary rather than a native GA4 metric.
| Area | Status | Assessment |
|---|---|---|
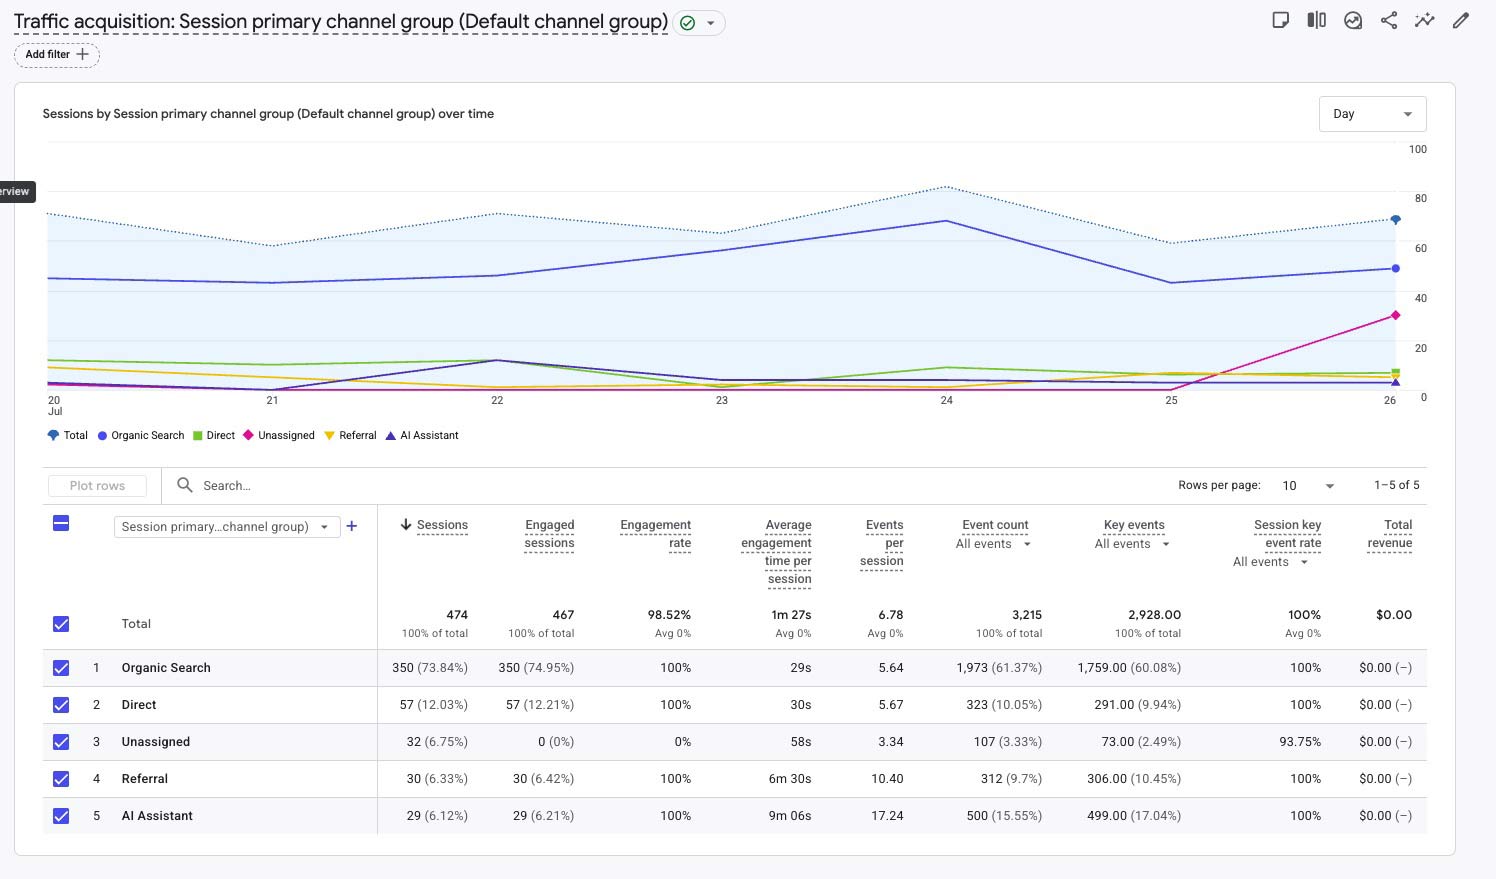
| SEO Momentum | Strong | Organic Search supplied 350 sessions and 73.8% of total traffic. |
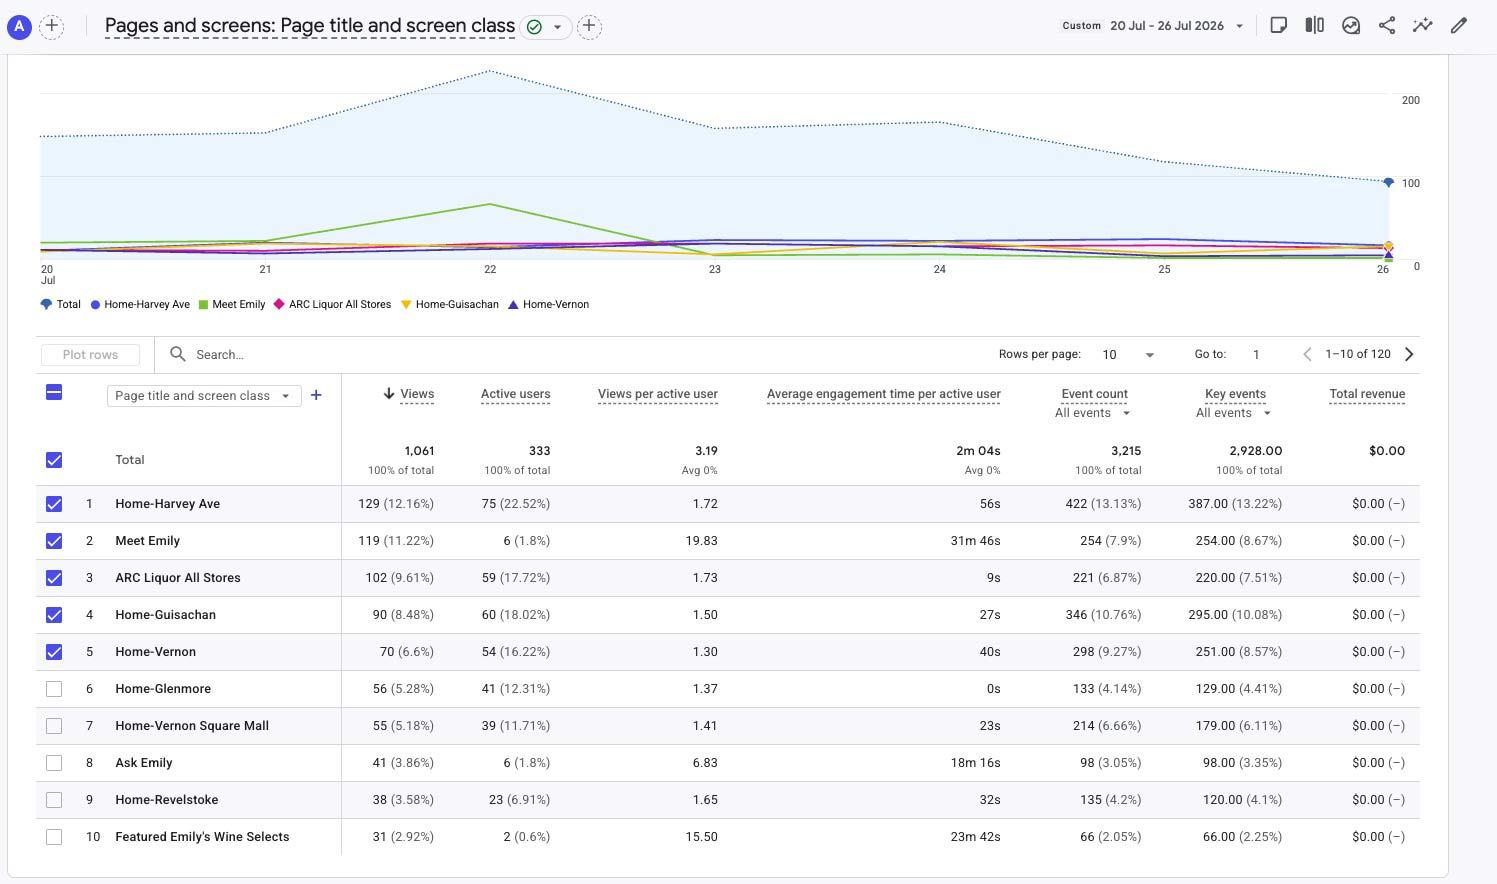
| Emily Engagement | Promising | Meet Emily became the website's second most-viewed page with 119 views. |
| AI Acquisition | Emerging | AI Assistant traffic increased from 2 to 29 sessions. |
| Customer Intent | Watch | Click-to-Shop remained meaningful at 152 but declined 15.6%. |
| Traffic Volume | Consolidating | Sessions declined 6.7% following Week 19's stronger activity. |
Weekly Wins
- Meet Emily recorded 119 views.
- AI Assistant traffic increased from 2 to 29 sessions.
- Organic Search delivered 350 sessions.
- Form submissions increased to 67.
- Form starts increased to 56.
- Ask Emily and Featured Emily's Wine Selects established measurable audiences.
Watch List
- Sessions declined 6.7%.
- Page views declined 25.8%.
- Referral traffic declined 49.2%.
- Emily engagement times include internal testing.
Digital Milestone: Emily Becomes Measurable
The Emily experience has moved from development into analytics. Meet Emily recorded 119 views, Ask Emily recorded 41, and Featured Emily's Wine Selects recorded 31.
Leadership interpretation: the page-view totals confirm meaningful early attention. The unusually long engagement times should be treated cautiously because the period included internal development and testing.
The next measurement step is to track how visitors move from Meet Emily into Summer Selects, Ask Emily, Product Finder and online shopping.
Performance Overview
Week 19 produced a softer volume story but a strategically useful customer-experience story. Sessions, views and events moderated after Week 18, while Emily content and AI Assistant acquisition became visible in GA4.
What this means: ARC is beginning to measure more than traffic alone. The reporting can now include brand engagement, editorial wine discovery and AI-assisted customer journeys.
| Metric | This Week | Previous | Change |
|---|---|---|---|
| Sessions | 474 | 508 | -6.7% |
| Engaged Sessions | 467 | 503 | -7.2% |
| Active Users | 333 | 350 | -4.9% |
| New Users | 293 | 315 | -7.0% |
| Page Views | 1,061 | 1,430 | -25.8% |
| Average Engagement Time | 2m 04s | 3m 57s | -47.4% |
| Event Count | 3,215 | 4,019 | -20.0% |
| Click-to-Shop | 152 | 180 | -15.6% |
Traffic Acquisition
| Channel | Sessions | Previous | Change | Interpretation |
|---|---|---|---|---|
| Organic Search | 350 | 378 | -7.4% | ARC's dominant source, supplying 73.8% of sessions. |
| Direct | 57 | 71 | -19.7% | Continued softness. |
| Referral | 30 | 59 | -49.2% | Normalized after Week 19's stronger result. |
| Unassigned | 32 | 35 | Review | Campaign and source tagging remain important. |
| AI Assistant | 29 | 2 | +1,350% | The absolute increase from 2 to 29 is the meaningful measure. |
Store and Content Performance
| Page | Views | Change |
|---|---|---|
| Home - Harvey Ave | 129 | -27.1% |
| Meet Emily | 119 | New |
| ARC Liquor All Stores | 102 | -5.6% |
| Home - Guisachan | 90 | -11.8% |
| Home - Vernon | 70 | -21.3% |
| Home - Glenmore | 56 | -35.6% |
| Home - Vernon Square Mall | 55 | -40.2% |
| Ask Emily | 41 | New |
| Home - Revelstoke | 38 | -33.3% |
| Featured Emily's Wine Selects | 31 | New |
Interpretation
Harvey remained the leading store homepage, but Meet Emily immediately entered as the second most-viewed page. The All Stores gateway retained 102 views, confirming that ARC now has several meaningful entry points rather than a single Harvey-first journey.
Ask Emily and Featured Emily's Wine Selects are still early-stage experiences, but their first measurable audiences justify dedicated campaign and conversion tracking.
Events and Customer Actions
| Event | Count | Change |
|---|---|---|
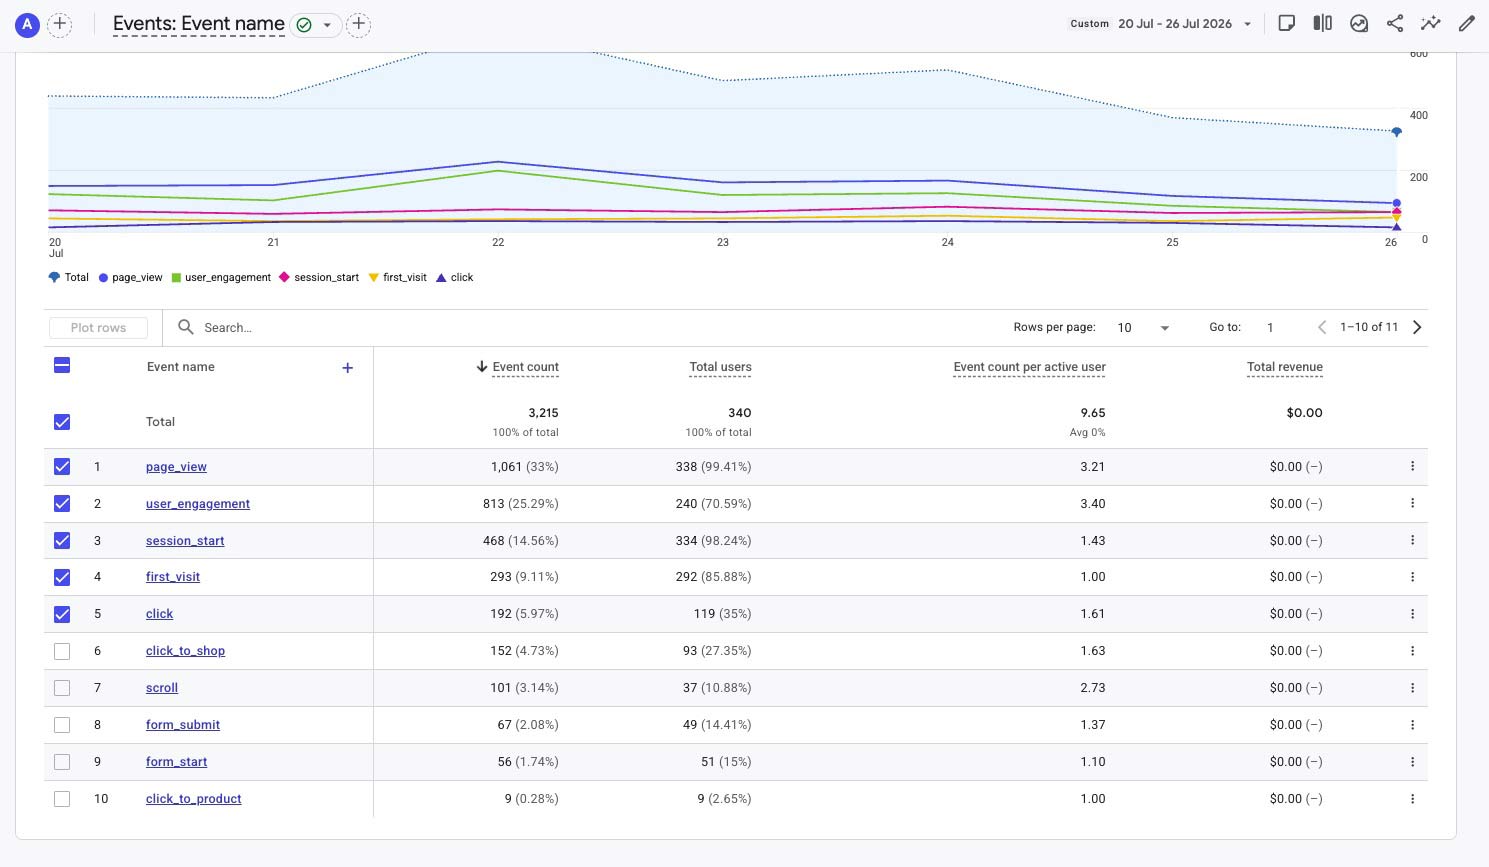
| page_view | 1,061 | -25.8% |
| user_engagement | 813 | -22.4% |
| session_start | 468 | -7.0% |
| first_visit | 293 | -7.0% |
| click | 192 | -13.1% |
| click_to_shop | 152 | -15.6% |
| scroll | 101 | -42.9% |
| form_submit | 67 | +8.1% |
| form_start | 56 | +9.8% |
| click_to_product | 9 | -30.8% |
Efficiency insight: most activity measures declined with the softer traffic level, but form starts and submissions improved. Click-to-Shop remained a meaningful commercial action at 152.
AI & Digital Tools Update
The ARC digital ecosystem now combines the all-store gateway, six store websites, Product Finders, conversational AI, Voice AI and the developing Emily brand experience.
Week 19 is the first reporting period where Meet Emily, Ask Emily, Summer Selects and AI Assistant acquisition can be interpreted together as parts of a connected customer journey.
Recommended Actions
- Add UTM tracking to every Emily CTA and in-store QR code.
- Track Meet Emily to Summer Selects, Ask Emily, Product Finder and Barnet transitions.
- Separate internal testing traffic where practical.
- Continue local SEO and Organic Search development.
- Review Referral and Unassigned attribution.
- Evaluate Week 20 as part of a three-week trend.
Trend Tracker
| Trend | Status | Why |
|---|---|---|
| Organic Search | Strong | 350 sessions and 73.8% of total traffic. |
| Emily Brand | Promising | Meet Emily recorded 119 views. |
| AI Assistant Acquisition | Emerging | Increased from 2 to 29 sessions. |
| Form Activity | Improving | Starts and submissions both increased. |
| Overall Volume | Consolidating | Sessions and event activity softened after Week 19. |
| Attribution Quality | Review | 32 sessions were classified as Unassigned. |
Supporting GA4 Reports
These images follow the numbered GA4 sequence and descriptive naming standard established for the weekly reporting package.